How the Knicks Won the 2026 NBA Title - Despite the Analytics
Five public-model calls. Five outcomes that broke them. A weekend stress-test of the modern NBA analytics stack against the Knicks' championship run, and what it reveals about the gap between what models measure and what actually decides a series.
June 17, 2026
First published on LinkedIn.
On the day Jalen Brunson won the Bill Russell Trophy as unanimous Finals MVP, he wasn’t in the top 20 of the most popular public impact metric in basketball.
The #1 player on that leaderboard? Victor Wembanyama - the man the Knicks had just beaten 4-1.
I spent the weekend stress-testing the 2026 Knicks playoff run against every major public analytics tool. EPM. DARKO. Shot Quality models. Synergy play types. In-game win probability.
Every single one got the key calls wrong.
Not because the metrics are bad. Because metrics describe a distribution, and the Knicks lived in the tail.
What actually happened
The Knicks won the 2026 Finals 4-1 over the Spurs on June 13. First title since 1973. NBA record for playoff point differential (+19.4 per game, +283 cumulative). Largest comeback in Finals history - down 29 in Game 4, won by one on an OG Anunoby tip-in with 1.2 seconds left. Brunson dropped 45 in the Game 5 clincher, rallying from 16 down.
Pre-playoff, every major model had them at 8-10%.
How they actually won it
Four rounds. Each one required a different version of the team. The models didn’t see any of the adjustments coming.
Hawks (4-2). Down 2-1 after a CJ McCollum buzzer-beater in Game 3. Mike Brown’s adjustment: expand the Bridges-Anunoby-Hart wing trio’s minutes and bring Guerschon Yabusele in as a backup stretch-five behind Towns. Offensive rating jumped from ~112 in Games 1-3 to over 130 in Games 4-6. Game 6 set the NBA playoff record for largest halftime lead at 47 points.
Sixers (4-0). The Brunson-as-gravity offense crystallized. Catch-and-shoot threes off his drives became the volume play. Game 4 the Knicks hit 25 threes - tied the all-time NBA playoff record - and won by 30. The system wasn’t just working. It was compounding.
Cavaliers (4-0). Defense became the weapon. The scheme switched 1-through-4 against Cleveland’s pick-and-roll. Anunoby and Hart took on-ball duties. Towns played deep-drop deterrent. Cleveland’s halfcourt offense never adjusted. The clincher set the NBA playoff record for most points without a single 20-point scorer - five Knicks all shooting plus, defense with nowhere to send help.
Spurs (4-1). Brunson became the only engine required. 32.6 PPG on .421 FG, 39.2 minutes per game. Game 4: down 29 at halftime against 14 first-half Spurs threes (a Finals record), won 107-106 on the Anunoby tip-in. Game 5: down 16, Brunson scores 45, series over.
What the analytics got right
The revision rate was the real signal. Between going down 2-1 to the Hawks and sweeping Cleveland, the Knicks’ implied title probability roughly 5x’d in three weeks - across sportsbook lines, ESPN BPI, EPM aggregates, and DARKO simultaneously. When independently-trained models all move that fast together, the underlying team has actually changed. The story was in the trajectory, not the snapshot.
The boring indicators were the most predictive all along. Point differential. Offensive/defensive rating split. Starter availability - all five starters played 66+ games, and the NBATA named their training staff Staff of the Year. Visible on basketball-reference.com all season. Free.
DARKO, used correctly, worked. Its Kalman filter is designed to move fast on recent evidence - the right tool for catching a scheme shift mid-postseason. Reading “DARKO says X today” as a state estimate is correct. Reading it as a forecast is the trap.
Five moments where the modern stack failed
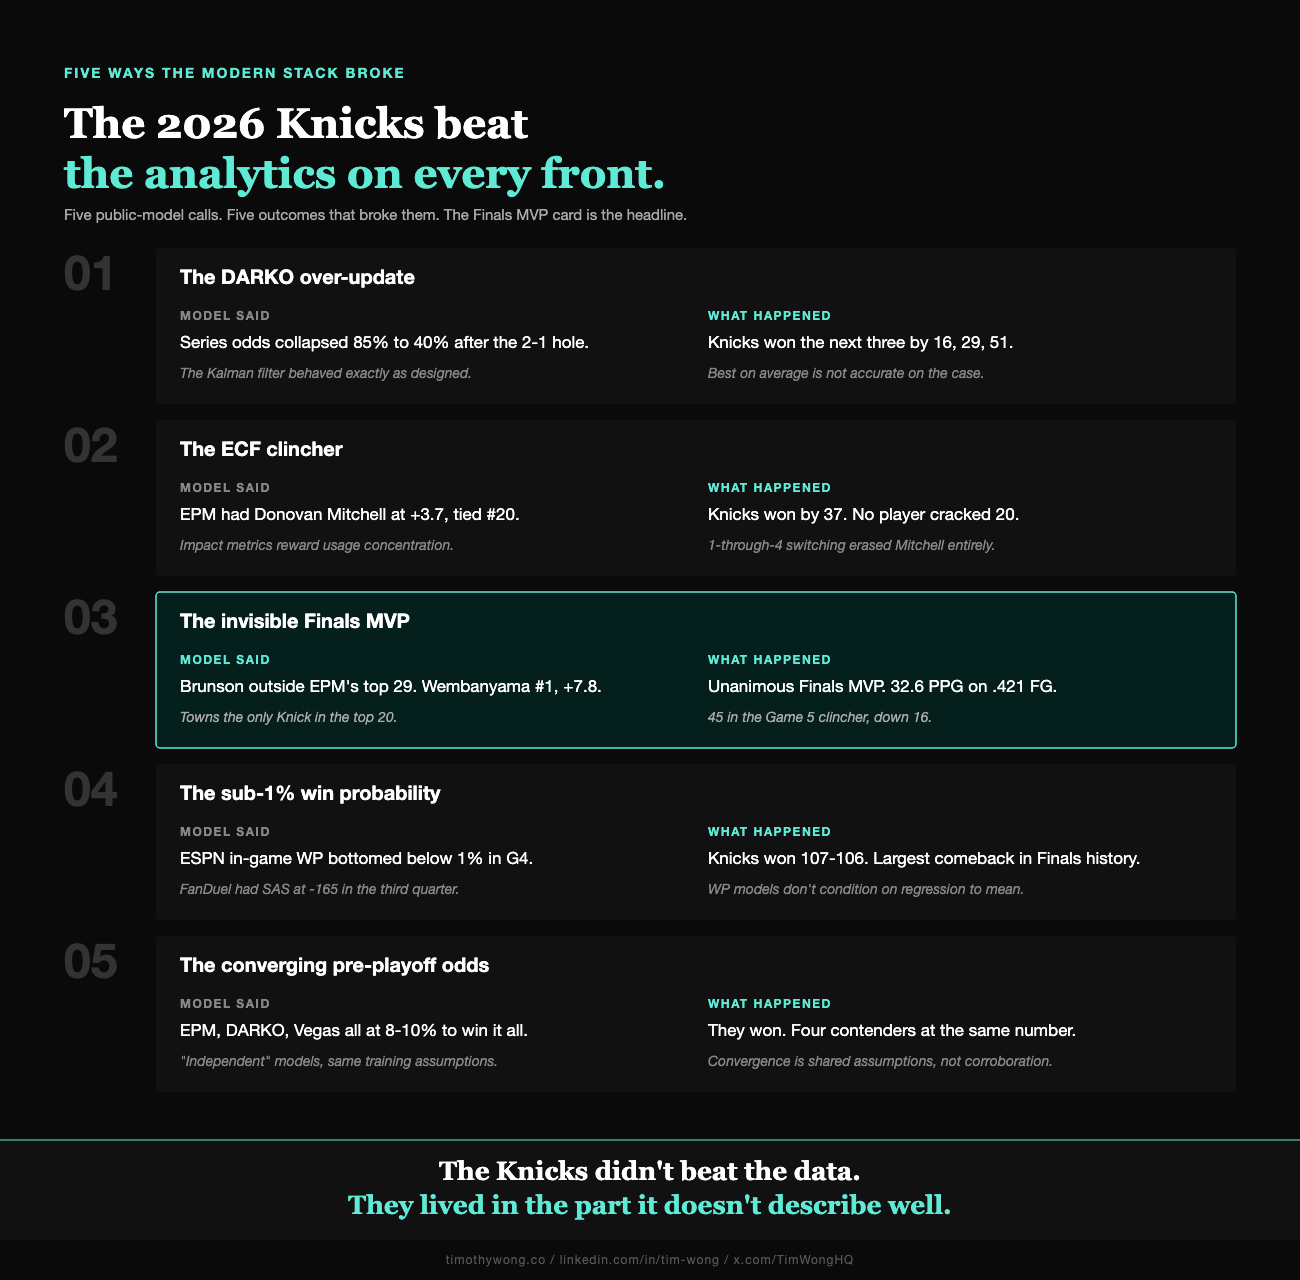
The DARKO over-update. After the Hawks took a 2-1 lead, DARKO - the best-RMSE forward-looking public metric - collapsed the Knicks’ series projection from ~85% to ~40% in three days. The Kalman filter did exactly what it was designed to do. Then Brown made his adjustments and New York won the next three by 16, 29, and 51. Best on average doesn’t mean accurate on the specific case.
The ECF clincher. EPM had Cleveland’s Donovan Mitchell at +3.7, tied for #20 in the league. The Knicks won by 37 with no player cracking 20. The 1-through-4 switching scheme made Mitchell’s individual impact irrelevant - the Knicks beat the system, not the star. Impact metrics reward usage concentration. Balanced rosters live in the cross-terms.
The invisible Finals MVP. Brunson: 32.6 / 4.6 / 4.2 / 2.0 on .421 shooting. Unanimous MVP. On the EPM leaderboard the day the trophy was handed out, he was outside the top 29. Wembanyama sat at #1 with +7.8. Karl-Anthony Towns was the only Knick in the top 20. Efficiency-first metrics punish the player solving the hardest problem - when defenses scheme everything off you, your true shooting collapses by construction. EPM penalized Brunson for the symptom of the problem he was solving.
The sub-1% win probability. Game 4. Down 29 at halftime. ESPN’s in-game model bottomed below 1%. FanDuel had the Spurs at -165 in the third quarter. The flaw: WP models don’t condition on shot-variance regression. San Antonio was shooting roughly 6 points above expected and was due back to the mean. The real number should have been 3-5%. Still long. Not the structural under-call the model delivered.
The converging pre-playoff odds. EPM team aggregates, DARKO, and Vegas all landed at 8-10%. Three “independent” models trained on the same regular-season possession data, with the same assumptions about playoff opponent stationarity. The flaw isn’t the prior - it’s interpreting 8-10% as “unlikely” when four contenders sit at the same number and combinatorics guarantees one of them takes it. Model convergence is shared assumptions producing shared output, not corroboration.
Same pattern across all five. The metric measured what it was designed to measure. The outcome lived where the measurement doesn’t reach.
The voters who gave Brunson the Bill Russell Trophy watched the games. They saw what the metric was structurally blind to: a guard absorbing every defensive scheme San Antonio could throw at him and still scoring 32 a night.
The modern stack is more sophisticated than the old Four Factors framework. It breaks in the same places. New inputs - tracking data, Kalman filters, shot context - don’t fix the structural issue: averages cannot predict tails.
And that’s exactly what makes the sport more exciting, not less.
The analytics are better than they’ve ever been. The Knicks still did something none of them saw coming. A coaching adjustment after a Game 3 buzzer-beater. A 29-point comeback that lived below 1% on every model. A Finals MVP invisible to the leaderboard that’s supposed to measure exactly what he does.
The gap between what the models can see and what actually decides a series isn’t a flaw to fix. It’s the reason the games are worth watching.